The Gold Rush (for the exits)
15 May 2025
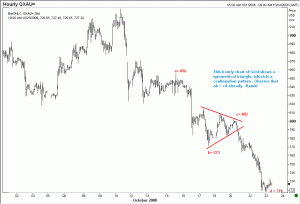
A couple of days ago, I tempered my bearish view on Gold by presenting a 30-minute chart. The sideways movement appeared to me as the beginning stages of a complex correction. Unfortunately, while the correction was “complex” in text-book terms, it didn’t quite recover sufficiently to give us another chance to shout “sell”. This is typical of complex corrections. It could take any form and turn with a speed that catches even an experienced trader off guard. The complex pattern that Gold traced was a symmetrical triangle. Here is the chart, with some comments written on it. | |
| |
Readers might be interested to visit the widely followed blog of my friend Michael Seneadza. Trader Mike has recently been observing a potential symmetrical triangle pattern developing in Nasdaq and the SNP500 index. Here is the link to his post. I have posted my views on Nasdaq separately. Trader Mike has been publishing for several years and has some interesting ideas. Enjoy. | |