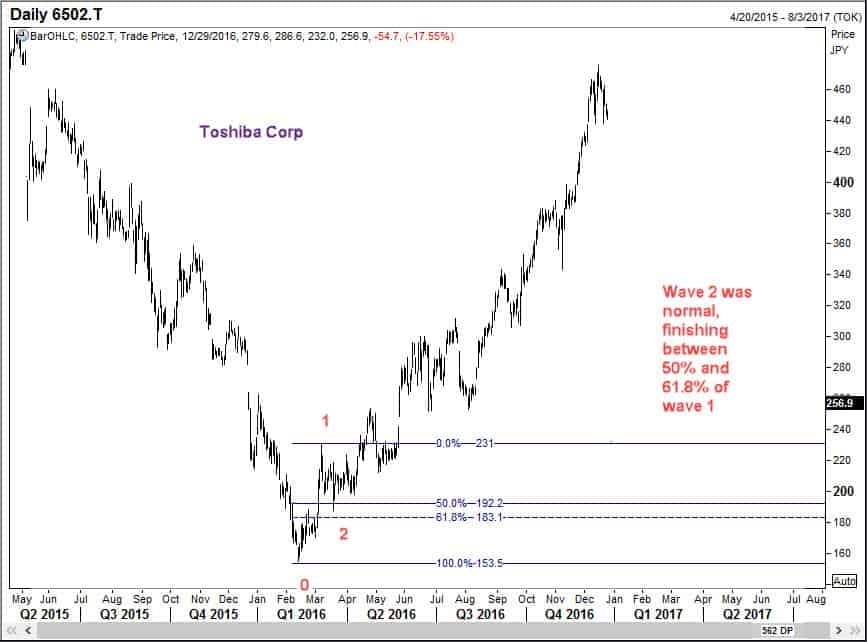
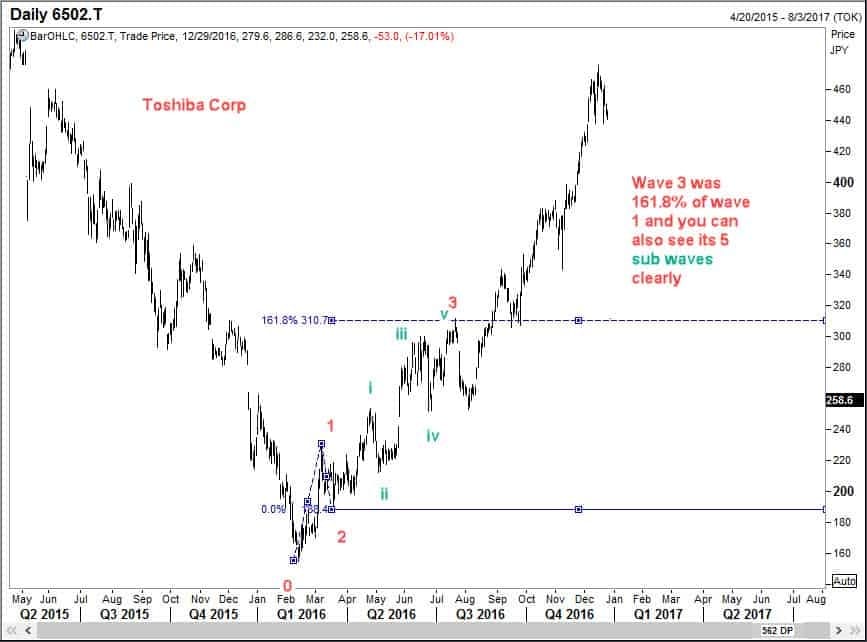
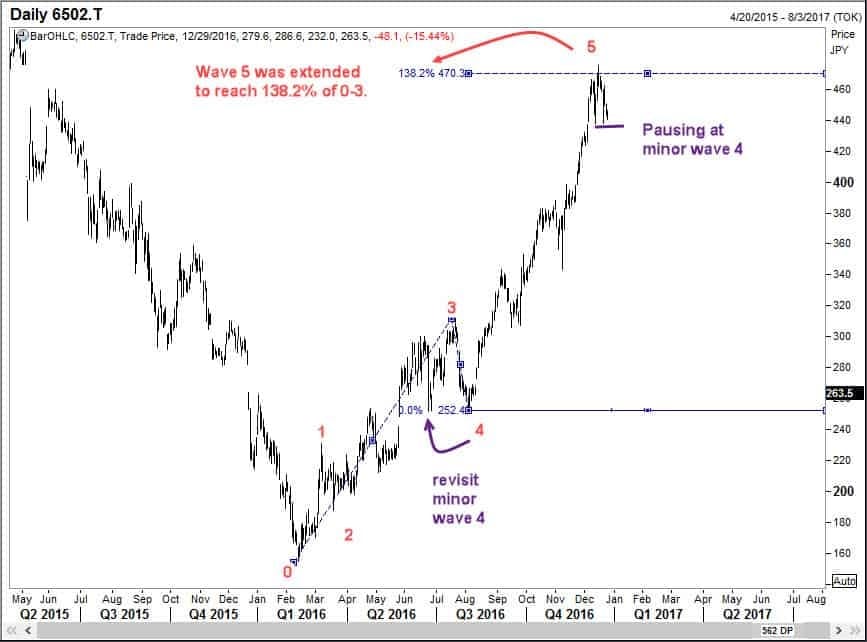
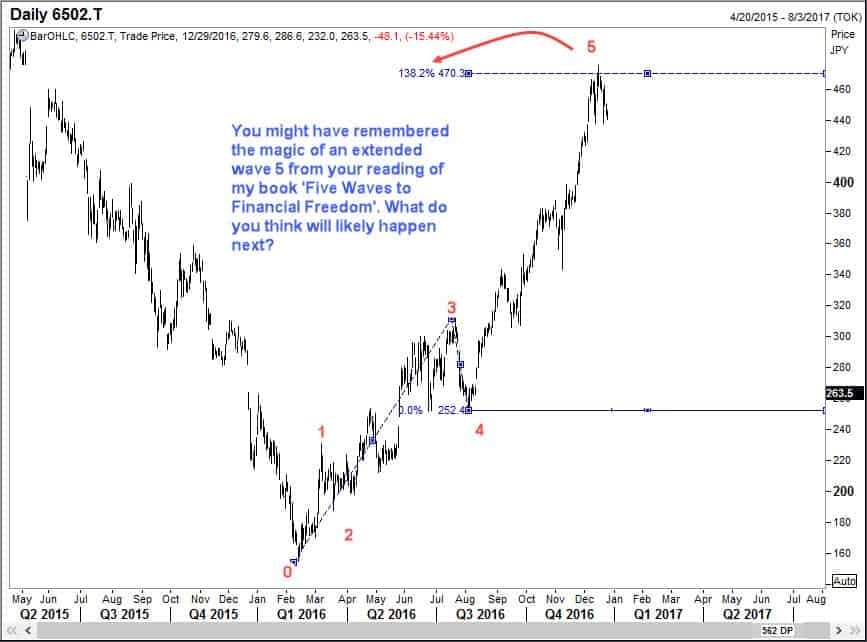
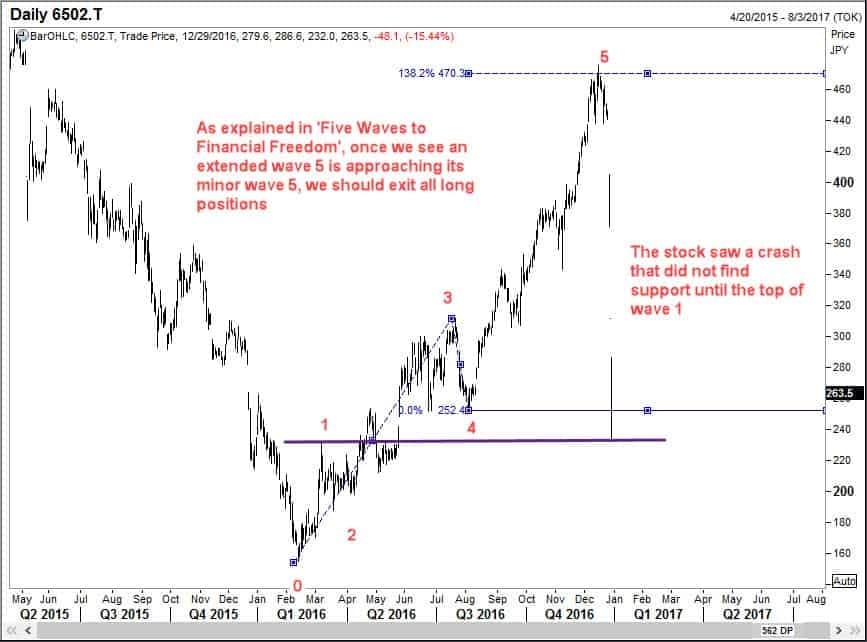
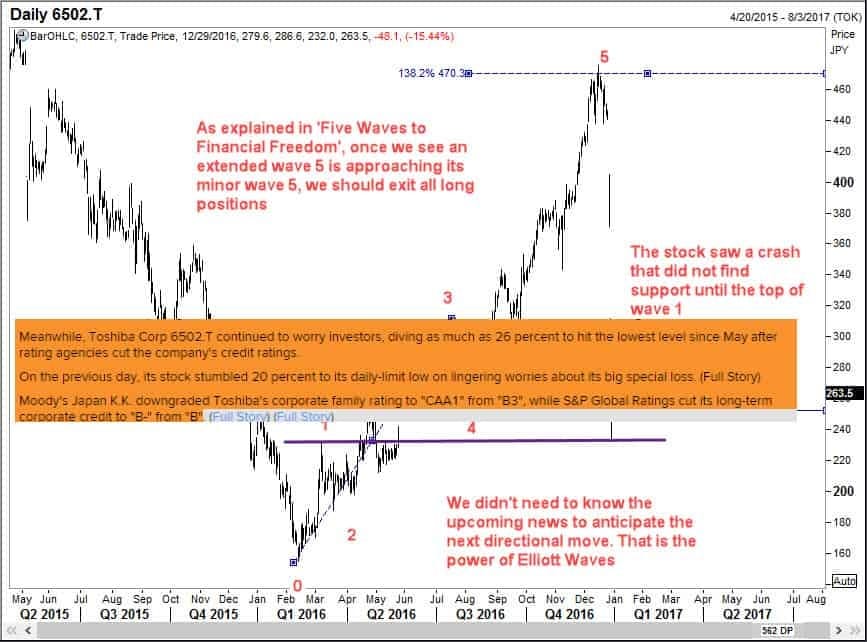
Regular readers of this blog would know that I call the occurrence of extended wave 5 as sheer magic, and Toshiba Corp is a case in question. We know that Toshiba has been having a great run since early 2016. From a low of 155 yen seen in February, the stock price of Toshiba Corp has been going up steadily, and reached a high of 475 on December 15, 2016. That means Toshiba Corp has tripled in value in just about 10 months. Now isn’t that wonderful? Imagine you are a fund manager who has been long and accumulating Toshiba at various supports. How would using Elliott Waves give you an edge? Let us take a look at several charts of Toshiba Corp and see how Elliott Wave analysis of Toshiba Corp would have helped us. | My comments on these charts of Toshiba Corp appear on the images directly. So I suggest that you open them on separate tabs first and then you can quickly read them one after the other. | | | | | | | Do we need more evidence of the power, nay, the magic of Elliott Wave analysis and of extended wave 5 in particular! Go back to Five Waves to Financial Freedom, your Elliott Wave book of reference, and read about how you too could benefit in future from such situations. | |
|