What Elliott Wave Really Provides That Indicators Cannot
A practical illustration of defining risk instead of predicting price
15 May 2025
An example of how wave structure identifies low-risk decisions before a trade begins. The emphasis is on when an idea becomes invalid, not on forecasting targets. | |
This example illustrates a central idea discussed in Why Intelligent Traders Misunderstand Elliott Wave: that analysis is most useful when it defines risk rather than predicts outcomes. | |
The Question Traders Usually Ask | |
Most traders approach analysis with a simple expectation: | |
So they search for combinations — oscillators, averages, confirmations — hoping agreement between tools will produce reliability. | |
But after some experience, a problem appears. | |
Indicators often agree at exactly the wrong moment. | |
They confirm strength near highs and weakness near lows. | |
This is not a defect of indicators. | |
The Real Difficulty in Trading | |
The challenge in trading is not identifying direction. | |
The difficulty is identifying acceptable risk. | |
Most losses do not come from wrong ideas. | |
So the practical question is not: | |
Traditional technical tools attempt to increase certainty. | |
What Wave Structure Changes | |
Wave analysis does not primarily forecast price. | |
It defines conditions. | |
Instead of producing a signal, it identifies a location where one of two things must happen: | |
| |
If behavior changes, the trade is exited quickly. | |
The method, therefore, does not attempt to be correct. It attempts to become wrong early. | |
This difference is subtle but decisive. | |
(The reasoning behind this decision-based approach is explored further in Five Waves to Financial Freedom.) | |
A Practical Illustration | |
| |
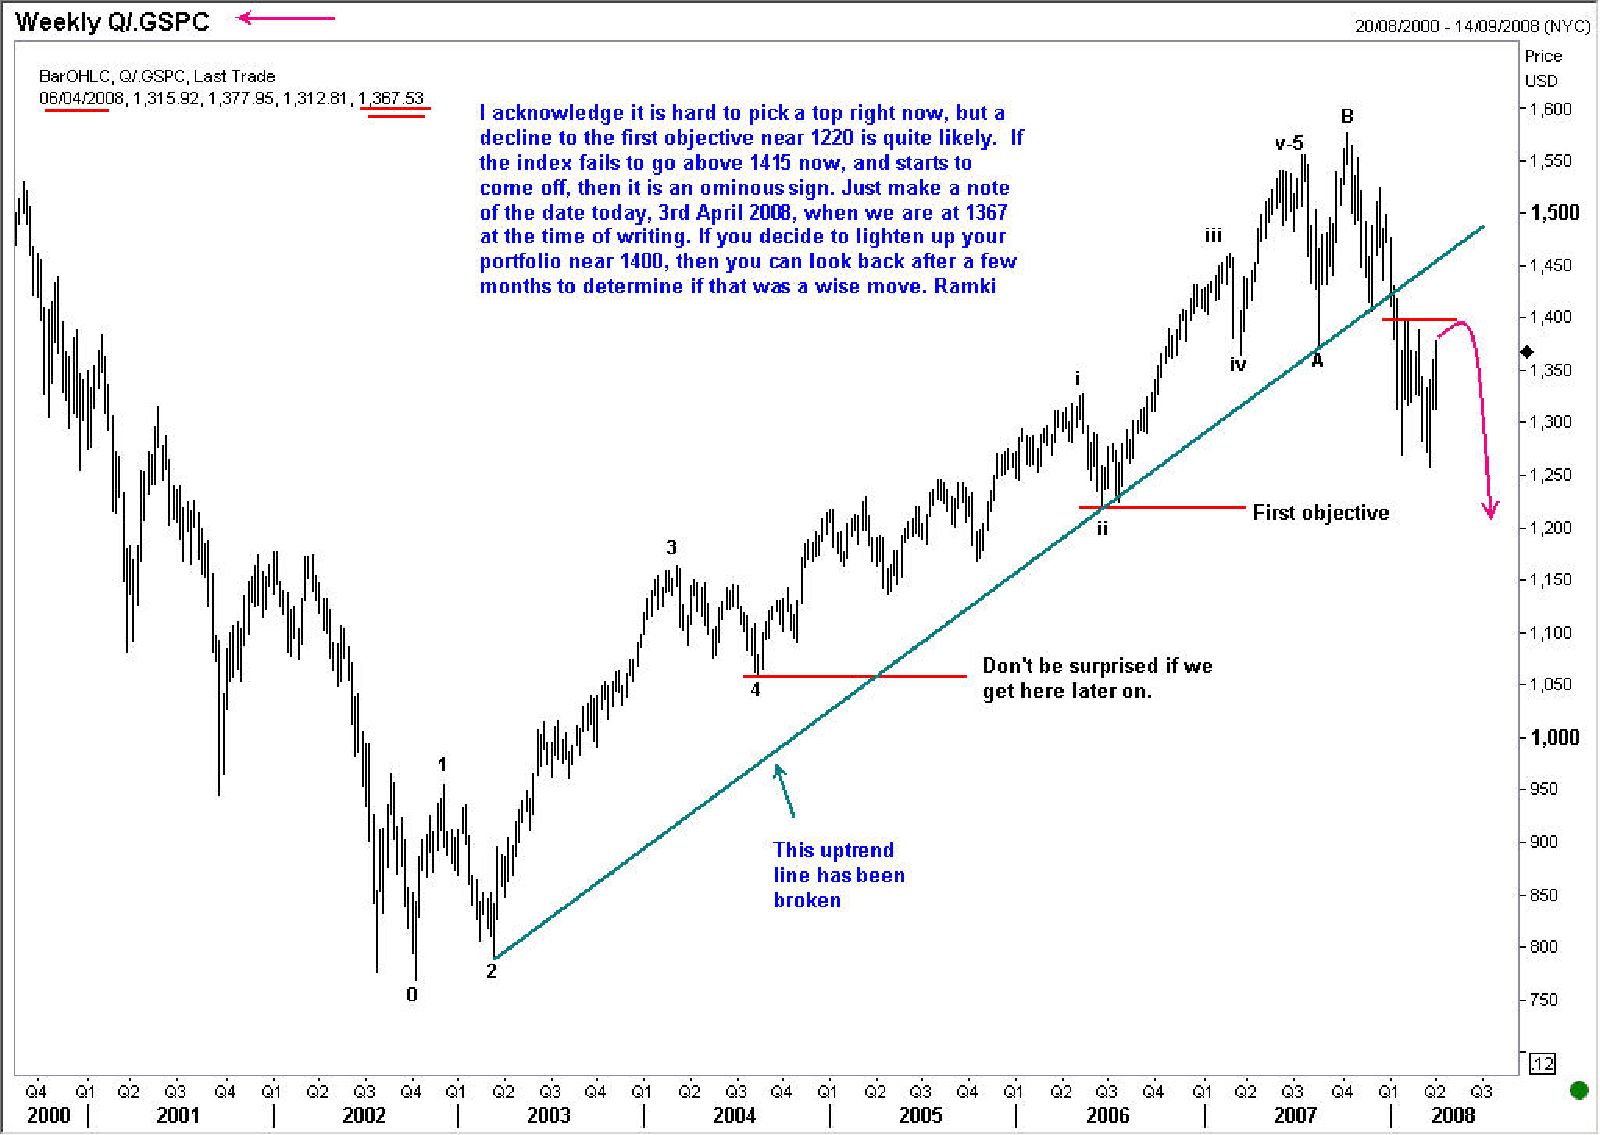
The relevance of the example is not the eventual magnitude of the move, but the small distance to invalidation. | |
I would like you to consider the above chart carefully. I wrote this on 3rd April 2008, when the S&P was at 1367. This is a weekly chart (which is why the date on the chart shows the last day of the week). If you go to Yahoo-Finance and look up the data for the weekly highs and lows from that date, you will observe that after spiking for one day to 1440 on 19th May 2008, the index never returned to those levels until the Global Financial Crisis had ended. The lowest low of 667 was seen on 6 March 2009. | |
In this example, the analysis did not depend on predicting the full move. | |
The important observation was that price had reached a point where continuation required specific behaviour. | |
The trade, therefore, began with a predefined exit, not a target. | |
Notice what mattered: | |
Not the eventual magnitude of the move, | |
That asymmetry, repeated consistently, produces results that prediction cannot. | |
Why Indicators Struggle Here | |
Indicators measure what has already occurred: | |
| |
They are excellent descriptive tools. | |
But trading decisions occur at the boundary between what has happened and what must happen next. | |
Wave structure focuses precisely on that boundary. | |
The Practical Takeaway | |
Elliott Wave analysis does not give certainty about the future. | |
It provides clarity about risk. | |
And in trading, clarity of risk is more useful than accuracy of opinion. The objective is therefore not to know the future, but to recognise when participation is justified. | |
These principles are discussed in more structured form in Five Waves to Financial Freedom, where the decision framework is developed in full. |